
Career Paths Visual
Explore the career opportunities associated with a role.
Access requirements
Permission with these capabilities: Career Path & Sourcing Path Visualizations
Reach out to your administrator for access.
For more information about accessing this visual, see Configuration details.
By loading the entire job history of all your employees into Visier, we can generate the Career Paths visual, which shows the natural movement of an employee through their career in your organization. The Career Paths visual allows you to identify an employee's opportunities and the time to progress to new roles based on their current position, as shown next.
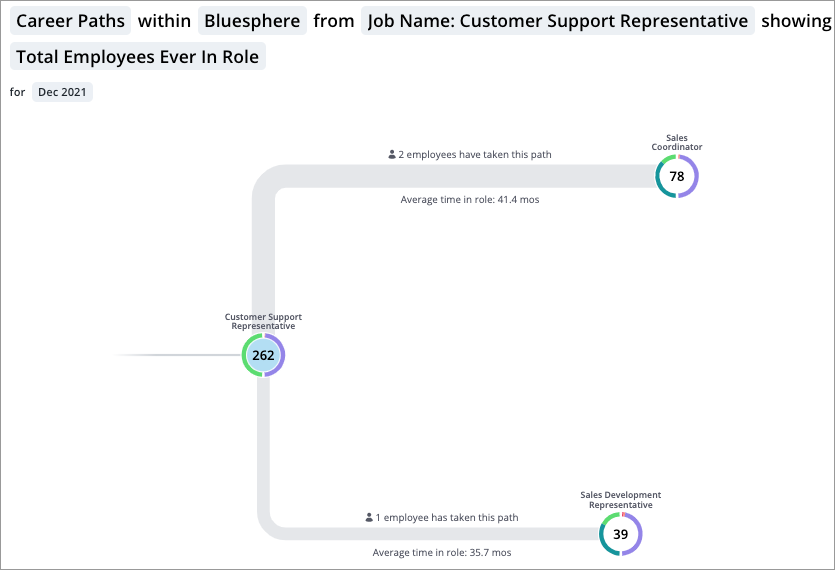
The visual consists of nodes that represent various jobs within your organization. Each node shows the job name and the number of employees who have ever had that job. The nodes are connected by lines that indicate a transition between jobs. The transition shows the number of employees who took that career path during the selected time period and the average time an employee held the previous role before making the transition.
If viewing a specific employee, the chart starts with the employee's current job and a list of jobs that they will typically move onto next. Explore the next level of jobs in the employee's career path by double-clicking the various nodes. You can also target a specific job and view the fastest or likeliest career paths to that job ranked in order from top to bottom.
Use the Career Path visual to show employees the career opportunities that they have within the organization and how fast their careers can develop.
Note:
- If you want to explore the paths that employees took to reach a specific job, we recommend that you use the Sourcing Paths visual. With the Sourcing Paths visual, you can select a target job to see the most common paths that employees took to that job in the past. For more information, see Sourcing Paths Visual.
- If the Career Paths visual cannot find any historical paths, try extending the time period.
- Data security is not applied to the visual until a filter is added. After a filter is added, metric values and job transitions will be calculated for the population that a user has access to. For more information about how filters are applied, see Filter behavior.
Visier Community Career Paths
Note:
- Additional Purchase This feature requires an additional cost. If you are interested, please contact your Customer/Partner Success Manager.
-
The dataset covers the period from January 2021 to December 2023.
By default, this visual will show you data from within your organization. Alternatively, you can also explore the data within the Visier Community, which is aggregated across Visier’s customers and can be used for benchmarking within your organization. Analyzing this broader data allows you to see a larger number of paths, so you can find suitable internal talent for a certain role outside of your conventional career progression.
To explore data in the Visier Community, select Visier Community and a Visier Occupation in the visual title.
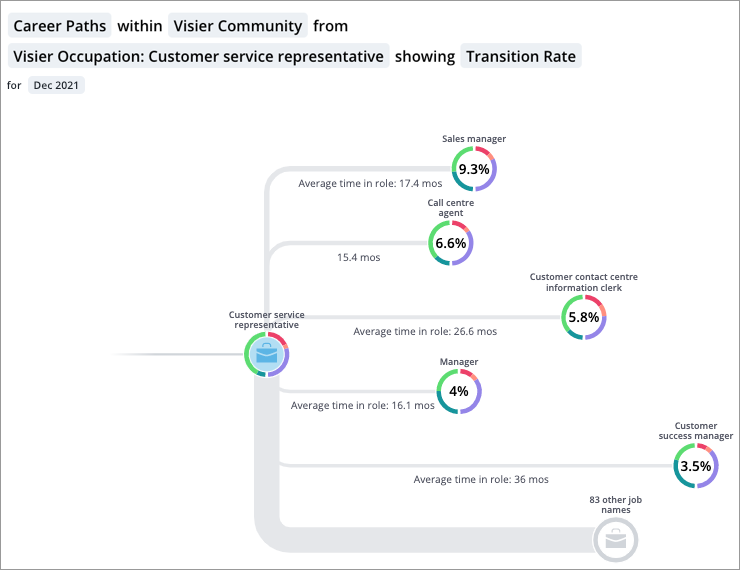
The data is aggregated, therefore the Transition Rate node values will display as percentages. The Transition Rate is calculated as the number of transitions from Job A to Job B divided by the sum of all transitions away from Job A. The data is aggregated on a yearly granularity and annualized. Annualization takes the rate and calculates what it would be over a year. If you are analyzing a time period in between years, the calculation will be weighted towards the year that has more data points. For example, if your time period is Sept 2021 to Sept 2022, the calculation will be weighted towards 2022.
How to access Career Paths
To explore the Career Paths visual:
| Where | Do this |
|---|---|
| Explore room | Click the Visual picker in the visual title and select Career Paths. |
| Detailed View visual |
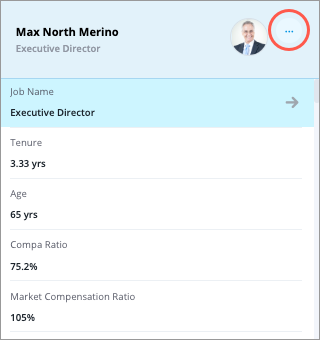
Select the employee you want to analyze and do one of the following:
|
| Compare room |
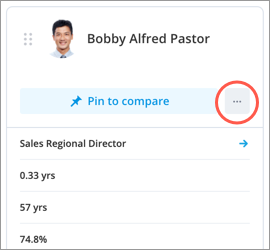
Add the employee you want to analyze to the comparison grid and do one of the following:
|
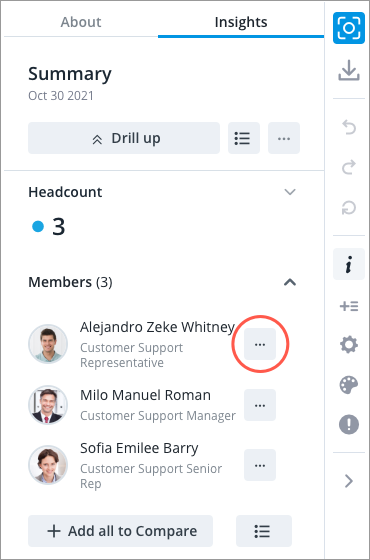
| Members section of the Insights tab in the Info panel |
Under the Members section in the Insights tab of the Info panel, click the More actions button
Note: For the Members section to appear, the following criteria must be met:
|
| Organization visual |
|
Tip: For a list of default attributes that are configured for this visual, see Default attributes.
Show paths to job
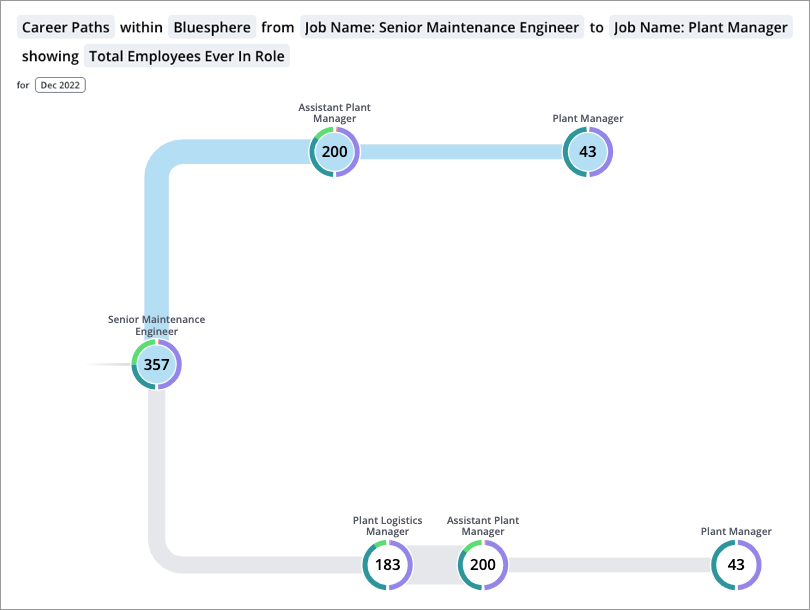
By default, the Career Paths visual shows all the potential career paths for the job or employee. To see the paths to a specific job, click the Show paths to job button ![]() on the Visual Actions menu and then select the job name the employee wants to reach. For example, the following screenshot shows the potential paths from Senior Maintenance Engineer to Plant Manager.
on the Visual Actions menu and then select the job name the employee wants to reach. For example, the following screenshot shows the potential paths from Senior Maintenance Engineer to Plant Manager.
When targeting a specific job, the visual can be configured to show one of two views:
- Fastest paths: The career paths that will allow the employee to reach the target job in the shortest amount of time based on the historical movement of employees in your organization.
- Likeliest paths: The career paths with the highest probability that will allow the employee to reach the target job based on the historical movement of employees in your organization.
Note:
- The visual displays up to five paths.
- The Fastest Paths view is displayed by default. You can switch views in the Show paths to job panel.
Default attributes
You can change the selected attribute in the Career Paths visual to explore in different ways. You can change the attribute in the visual title.
By default, you can use the following attributes to explore the visual:
- Employee: The employees in your organization. This attribute is shown as the full name of a selected employee.
- Lightcast Standard Job Name: The employee's standardized job name derived from the Lightcast data set.
- Job Family: The group of jobs involving similar responsibilities and qualifications that the employee’s job belongs to.
- Job Name: The functions performed by the employee or requisition.
- Visier Occupation: Visier's occupation taxonomy that groups jobs into domains and sub-domains of occupational activity, which expands on ESCO (European Skills, Competences, Qualifications and Occupations) through enrichment with additional standardized occupations.
- SOC Hierarchy: The standard hierarchical structure of occupational titles in the organization. This is based on a hybrid structure of the 2010 and 2018 Standard Occupational Classification (SOC) system and enriched with additional standardized occupations from Lightcast.
Changing the selected attribute allows you to view the potential career paths of employees in terms of internal job names, job families, standardized occupational titles, or individual employees. Job names are often too detailed, with too many unique values. Using job families is a good way to get a smaller number of values and will help you better understand the job description and the skills that are needed so you and your employees can make better hiring and career development decisions.
Administrators can change the dimensions that are available for this visual. For instructions, see Configure Visuals.
Tip: The default Career Paths attribute differs by the entry point. For example, if you enter Career Paths from Explore, the default is Job Name. If you enter from Detailed View or Compare, the default is the selected employee.
How to explore the visual to gain insight
Tip: To quickly find key insights, navigate to the Insights tab of the Info panel. For more information, see The Info Panel.
- Add filters to view data for a specific group of employees or analysis population.
- Look on the right side of the chart to see the jobs that can be moved to from the current role.
- Double-click a node to explore different career paths and the next level of potential jobs.
- Hover over a node to see a summary of the employee movement for the job.
- Hover over a line to see a summary of the transition.
- Transition count: The number of employees that have made this job move.
- Average time in role: The average length of time an employee held a job before making the transition.
- Compare the paths an employee can take by looking at the line widths.
- The line width represents the transition likelihood. The thicker the line, the more likely it is that employees will move into this job.
- See which employees can provide guidance and insights about a job transition. Select a path. Then, in the Info panel, click View details to view the employees who have chosen this path.
- See which employees can provide guidance and insights about a job. Select a node. Then, in the Info panel, click View details to view the current employees who have this job.
- Target a specific job and view potential career paths to reach that job. On the Visual Actions menu, click the Show paths to job button
 and select the job name to target.
 - When targeting a specific job, do any of the following:
- Change the paths view to explore the fastest or likeliest career paths.
- Select a career path to see the series of jobs an employee will move through and the amount of time they should expect to spend at each job.
- To see where an employee can go from their target job, in the Info panel click Add job to path and select another job.
- To explore the various jobs in a career path, click Back in the Show paths to job panel.
Note: Right-click on a chart item or data point to open the Visual Item Actions menu. Find actions that will allow you to quickly interact with points of interest. Actions include drilling up or down to view different levels of your data, exploring a specific attribute, and accessing Detailed View to see a list of subject members or event occurrences that make up a given population.
Calculation details
Career paths are calculated as the transition likelihood from one job to another, the fastest path to a job, or the likeliest path to a job.
Transition likelihood calculation details
The transition likelihood is based on the percentage of employees who have moved from Job A to Job B compared to all employees who have moved out of Job A.
Example:
- We are looking at the Career Journey for an employee who is currently a Graphic Designer.
- The jobs the employee will most likely move to next are Product Designer, Product Manager, and Senior Graphic Designer.
- Of the 50 employees who have moved out of the Graphic Designer job, 15 employees moved into the Product Designer job, 10 employees moved into the Product Manager job, and 25 employees moved into the Senior Graphic Designer job.
The transition likelihood for Graphic Designer to Product Designer is calculated as follows:
![]()
The transition likelihood for Graphic Designer to Product Manager is 20% and the transition likelihood for Graphic Designer to Senior Graphic Designer is 50%. The line widths are determined by the transition likelihoods of the different paths. In this example, the path from Graphic Designer to Senior Graphic Designer will have the thickest line and the path from Graphic Designer to Product Manager will have the thinnest line.
Fastest paths calculation details
When looking at the career path to a specific job, the Fastest paths view shows all possible career paths ranked according to the average transition time. The average transition time for a career path is the sum of the average amount of time employees spend in a job for each individual step.
Example:
To move from Graphic Designer to Product Manager, an employee can take the following career path:
- Graphic Designer to Product Designer
- Product Designer to Product Marketer
- Product Marketer to Product Manager
On average an employee spends:
- 42 months as a Graphic Designer before becoming a Product Designer.
- 35 months as a Product Designer before becoming a Product Marketer.
- 41 months as a Product Marketer before becoming a Product Manager.
The average transition time for this career path is calculated as follows:
![]()
Likeliest paths calculation details
When looking at the career path to a specific job, the Likeliest paths view shows all possible career paths ranked according to the career path transition likelihood. To calculate the transition likelihood for a career path, we look at the transition likelihood for each individual step.
Example:
Let's calculate the career path likelihood for the previous example: Graphic Designer to Product Manager.
To calculate the transition likelihood for Step 1 of the career path, we look at the employees who have moved out of the Graphic Designer job. The transition likelihood is based on the percentage of employees who have moved from Job A to Job B compared to all employees who have moved out of Job A. Of the 50 employees who have moved out of the Graphic Designer job, 15 employees moved into the Product Designer job. The transition likelihood for Graphic Designer to Product Designer is calculated as follows:
![]()
The transition likelihood for the entire career path is the product of the transition likelihoods for each individual step. Let's say the transition likelihood for Step 2 is 80% and Step 3 is 75%. The transition likelihood for the Graphic Designer to Product Manager career path is calculated as follows:
![]()
About Detailed View
To provide users with accurate information about the jobs and paths within an organization, the visual is presented without security restrictions when there are no filters applied. This means that all users will see the same data and paths. However, the data that is available in the Detailed View visual is restricted by the user's security access. As a result, users may see a difference between the Transition Count or Headcount and the number of employees listed in Detailed View.
Filter behavior
If the employee meets the filter criteria at any point during the selected time period, they will be included in the transition count. This may lead to discrepancies when comparing the number of records in the Detailed View visual and the number of transitions made. Detailed View will only show records for employees who meet the filter criteria at the end of the selected period.
Consider the job histories of employees who moved from Customer Support Specialist to Sales Coordinator:
| Employee | Customer Support Specialist | Sales Coordinator |
|---|---|---|
| A | 2018, located in the United States | 2020, located in Canada |
| B | 2016, located in Canada | 2019, located in the United States |
| C | 2021, located in Canada | 2022, located in Canada |
| D | 2014, located in the United States | 2018, located in the United States |
Let's say you're looking at job transitions from January 2013 to December 2022 and you've applied a filter for the United States to the visual. You'll see the following information:
- Employee A is included in the job transition from Customer Support Specialist to Sales Coordinator. Employee A is included in the Customer Support node in Detailed View.
- Employee B is included in the job transition from Customer Support Specialist to Sales Coordinator. Employee B will be included in the Sales Coordinator node in Detailed View.
- Employee C is excluded from the visual because they don't meet the filter criteria at any point during the selected time period. They remained in Canada.
- Employee D is included in the job transition from Customer Support Specialist to Sales Coordinator. Employee D is included in the Customer Support Specialist and Sales Coordinator nodes in Detailed View.
Configuration details
The following objects must be configured for this visual to appear and work correctly. Contact your administrator if the visual is not appearing correctly.
Data must be loaded and configured for:
- Employment Start event (Employment_Start)
- Employee Exit event (Employee_Exit)
- Job Name dimension (Job_Name)
- Optional: Job Family dimension (Job_Family)
Attributes you've configured for the visual must also be added to the Career Movement concept (careerMovement) in order for Detailed View to work.
Users must have aggregate data access to:
- All properties of the Employee Start event
- All properties of the Employee Exit event
Users must have detailed data access to:
- Job Name property of the Employee subject
- Optional: Job Family property of the Employee subject
Add the following metrics to each child tenant's custom module to make the visual available:
- Employee Count Including Inactive Employees (employeeCountIncludingInactives)
- Career Internal Move Count (careerInternalMovementInCount)